

Show Your Stripes Day highlights global and local warming
 An illustration of the earth's warming temperatures over the period 1850-2023 as of June 21, 2024, also known as Show Your Stripes Day. The initiative is meant to raise awareness about climate change. (Credit: showyourstripes.info / Professor Ed Hawkins, University of Reading_
It's the seventh annual Show Your Stripes Day. The initiative is designed to help visualize human-caused warming around the world.
The warming stripe graphics show the change in temperature (relative to the 1961-2010 average) for cities and countries around the world.
The darker the red, the further above average and the blues get darker as temperatures fall further below average.
 An illustration of Edmonton's warming temperatures over the period 1850-2023. (Credit: showyourstripes.info / Professor Ed Hawkins, University of Reading_
These are the stripes for Edmonton. The left side of the image is 1850, with 2023 at the far right.
There are definitely warmer than average years in the left and middle parts of the image, but there's a wider band of reds and pinks in more recent years.
That's a bit easier to pick out with the bar graph image below.
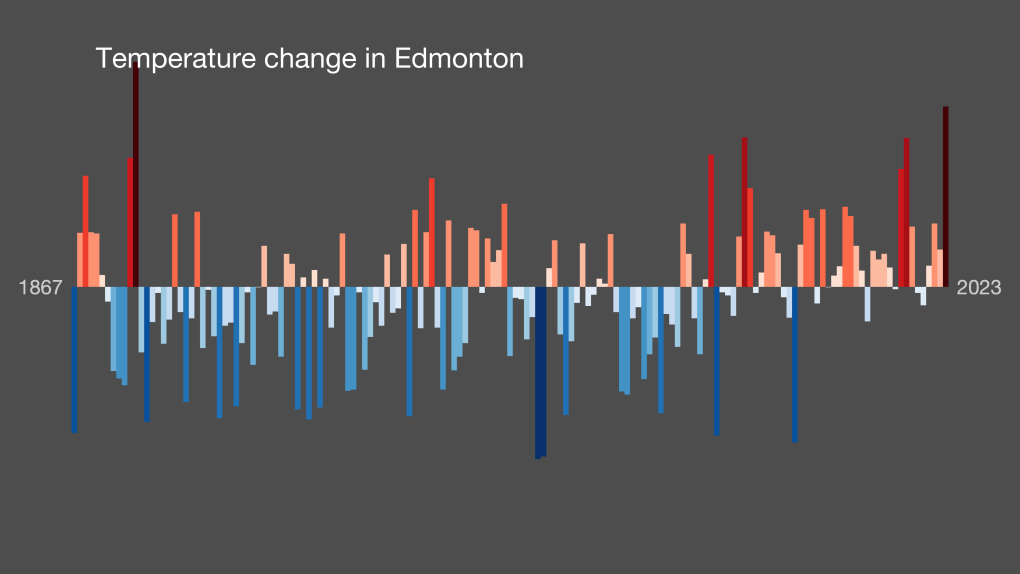 An illustration of Edmonton's warming temperatures over the period 1850-2023. (Credit: showyourstripes.info / Professor Ed Hawkins, University of Reading_
Again, you see some warm years early in the timeframe (left and middle side of the image). Then, we have a cluster of warmer than average years in more recent history and the cooler than average years (blue bars) almost completely disappear.
The image below is the warming stripes for Canada as a whole.
 An illustration of Canada's warming temperatures over the period 1850-2023. (Credit: showyourstripes.info / Professor Ed Hawkins, University of Reading_
Clearly, not every region is warming at the same rate as the increase in temperature is much more noticeable for Canada than it is for Edmonton.
Globally, the warming trend is even more striking.
The images below are the warming stripes and warming bars for the entire planet.
An illustration of the earth's warming temperatures over the period 1850-2023 as of June 21, 2024, also known as Show Your Stripes Day. The initiative is meant to raise awareness about climate change. (Credit: showyourstripes.info / Professor Ed Hawkins, University of Reading_
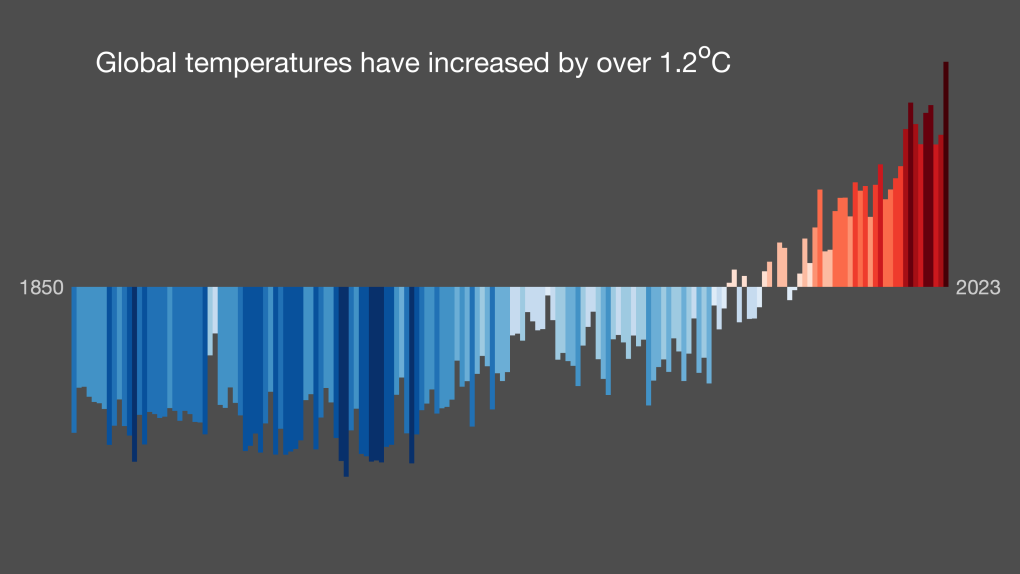 An illustration of the change in the earth's temperatures from 1850-2023. (Credit: showyourstripes.info / Professor Ed Hawkins, University of Reading)
 An illustration of the change in the earth's temperatures from 1850-2023. (Credit: showyourstripes.info / Professor Ed Hawkins, University of Reading)


CTVNews.ca Top Stories
7 suspects, including 13-year-old, charged following 'violent' home invasion north of Toronto
Seven teenage suspects, including a 13-year-old, have been arrested following a targeted and “violent” home invasion in Vaughan on Friday, police say.
After Trump's Project 2025 denials, he is tapping its authors and influencers for key roles
After being elected the 47th president on Nov. 5, Donald Trump is stocking his second administration with key players in the Project 2025 movement he temporarily shunned.
Widow of Chinese businessman who was executed for murder can sell her Vancouver house, court rules
A murder in China and a civil lawsuit in B.C. have been preventing the sale of multiple Vancouver homes, but one of them could soon hit the market after a court ruling.
These vascular risks are strongly associated with severe stroke, researchers say
Many risk factors can lead to a stroke, but the magnitude of risk from some of these conditions or behaviours may have a stronger association with severe stroke compared with mild stroke, according to a new study.
Retiring? Here's how to switch from saving for your golden years to spending
The last paycheque from a decades-long career arrives next Friday and the nest egg you built during those working years will now turn into a main source of income. It can be a jarring switch from saving for retirement to spending in retirement.
Lotto Max jackpot climbs to $80M, tying record for largest prize
The Lotto Max jackpot has climbed to $80 million for just the second time in Canadian lottery history.
Black bear killed in self-defence after attack on dog-walker in Maple Ridge, B.C.
A black bear has died following a brawl with a man on a trail in Maple Ridge, B.C.
Trump picks Brooke Rollins to be agriculture secretary
U.S. President-elect Donald Trump has chosen Brooke Rollins, president of the America First Policy Institute, to be agriculture secretary.
Police thought this gnome looked out of place. Then they tested it for drugs
During a recent narcotics investigation, Dutch police said they found a garden gnome made of approximately two kilograms of MDMA.
Shopping Trends
The Shopping Trends team is independent of the journalists at CTV News. We may earn a commission when you use our links to shop. Read about us.


Calgary
-

Snowfall warning for Calgary and southern Alberta expected to continue throughout Saturday
A snowfall warning for Calgary remained in effect early Saturday morning and looks poised to be hanging around all weekend.
-
Calgary Ukrainian community gathers to commemorate the Holodomor
Calgary’s Ukrainian community commemorated the Holodomor Saturday in a ceremony that paid tribute to millions of victims from the past and to remind the world of the parallels to what is taking place in Ukraine in 2024.
-
‘Pinch me I’m dreaming:’ Calgary drummer pulled from crowd to play with the Arkells
For young musicians, to be up on stage in front of thousands of people, would be a dream come true. That’s exactly what happened to a Calgary girl, after being invited to play with Canadian rock icons The Arkells.
Lethbridge
-

Hurricanes road misery continues with 6-3 loss to Winterhawks in Portland
The Hurricanes dropped their third straight game on Friday night, losing 6-3 to the Winterhawks in Portland.
-
Emergency water main break disrupts traffic on 5 Avenue North in Lethbridge
City crews are working to repair an emergency water main break on 5 Avenue North between 28 Street North and 29 Street North Saturday morning.
-
Lethbridge’s Ron Sakamoto honoured at Country Music Awards in Nashville
Lethbridge’s Ron Sakamoto is bringing home the hardware from this year’s Country Music Awards.
Saskatoon
-

'I'm excited to take it on': Saskatoon businesses weigh in on GST exemption
Some local businesses say the federal government’s recent plan to pull back GST on several items is a positive initiative, but it should have been rolled out earlier in the holiday season.
-
Watermain break closes Saskatoon road
The City of Saskatoon is advising motorists of road closures due to a watermain break that caused flooding on Millar Avenue near Circle Drive.
-
Why isn't Saskatoon's new downtown shelter open yet?
Saskatoon's new downtown shelter must undergo renovations before it can open, according to the operator of the site.
Regina
-

Navy wife brings together local authors for inaugural book fair
Sixteen local authors and book publishers gathered Saturday for the first ever Regina Bookwyrm’s Book Fair, organized by a Navy wife.
-
City of Regina releases snowfall response plan ahead of next blast of wintery weather, snow routes declared
Many parts of Saskatchewan will be hit with another round of wintery weather on Saturday, and Regina is no exception, with up to 25 centimetres of snow expected to accumulate by Sunday.
-
NDP calls for investigation into food prices in northern Sask. after scurvy cases discovered
The Saskatchewan NDP is calling for an investigation into food prices in the northern part of the province after 27 cases of scurvy were discovered.
Vancouver
-

Widow of Chinese businessman who was executed for murder can sell her Vancouver house, court rules
A murder in China and a civil lawsuit in B.C. have been preventing the sale of multiple Vancouver homes, but one of them could soon hit the market after a court ruling.
-
Black bear killed in self-defence after attack on dog-walker in Maple Ridge, B.C.
A black bear has died following a brawl with a man on a trail in Maple Ridge, B.C.
-
Man arrested after allegedly attempting to set fire to Vancouver City Hall
A 36-year-old man was arrested and is facing criminal charges after allegedly trying to start a blaze at the front of Vancouver City Hall Friday night.
Vancouver Island
-

BC Hydro says power almost fully restored after B.C. windstorms
British Columbia's electric utility says it has restored power to almost all customers who suffered outages during the bomb cyclone earlier this week, but strong wind from a new storm has made repairs difficult in some areas.
-
Fall legislative sitting scrapped in B.C. as Speaker Chouhan confirmed to serve again
There won't be a sitting of the British Columbia legislature this fall as originally planned.
-
Canada Post down eight million parcels amid strike as talk carry on over weekend
Canada Post says it has seen a shortage of more than eight million parcels amid an ongoing strike that has effectively shut down the postal system for nine days compared with the same period in 2023.
Toronto
-
7 suspects, including 13-year-old, charged following 'violent' home invasion north of Toronto
Seven teenage suspects, including a 13-year-old, have been arrested following a targeted and “violent” home invasion in Vaughan on Friday, police say.
-
'Her shoe got sucked into the escalator': Toronto family warns of potential risk of wearing Crocs
A Toronto family is speaking out after their 10-year-old daughter's Crocs got stuck in an escalator, ripping the entire toe area of the clog off.
-
Lotto Max jackpot climbs to $80M, tying record for largest prize
The Lotto Max jackpot has climbed to $80 million for just the second time in Canadian lottery history.
Montreal
-

Montreal prepares to sell long-abandoned Empress theatre
The Empress Theatre, a nearly century-old landmark in Montreal's Notre-Dame-de-Grâce (NDG) neighbourhood, may soon be revitalized.
-
Santa Claus Parade draws crowds to downtown Montreal
Thousands gathered on René-Lévesque to welcome Santa Claus at this year’s festive parade. Choir groups, marching bands, dancers and more brought the holiday joy this year.
-
Quebec MNAs continue screen time consultations with students
Quebec's special commission on the impact of screen time and social media addiction among youth made a stop at Westmount High School this week, speaking directly with students about their habits and concerns.
Atlantic
-

'We need answers': Protest held at RCMP detachment for suspicious disappearance of N.B. man
A crowd of over 20 people stood in the pouring rain Saturday in front of the RCMP detachment in Hampton, N.B., to bring awareness to a missing person’s case.
-
Canada Post down eight million parcels amid strike as talk carry on over weekend
Canada Post says it has seen a shortage of more than eight million parcels amid an ongoing strike that has effectively shut down the postal system for nine days compared with the same period in 2023.
-
17-year-old dies following single-vehicle crash in Turtle Creek: N.B. RCMP
A 17-year-old boy from Petitcodiac, N.B., has died following a single-vehicle crash in Turtle Creek, N.B.
Winnipeg
-

Winnipeg Ukrainians commemorate 91st anniversary of Holodomor as war rages on overseas
Members of Winnipeg’s Ukrainian community came together outside City Hall to remember the lives lost in the past, as well as those giving their lives in the current day.
-
Missing Neepawa senior found dead: RCMP
An 81-year-old man who went missing Friday has been found dead, Spruce Plains RCMP said.
-
Snowfall warning in effect for southwestern Manitoba
Some areas could expect snowfall totals of 15 to 25 centimetres.
Ottawa
-

Mixed reaction from Ottawa business owners, customers on GST exemption
Business owners say they've been left with questions about how a temporary tax exemption to the GST will work after the federal government announcement the policy last week.
-
Ottawa councillor violated Code of Conduct for daycare incident last summer, integrity commissioner concludes
The City of Ottawa's integrity commissioner has found West-Carleton March Coun. Clarke Kelly has violated the Code of Conduct for city officials and should be reprimanded following an altercation with a local daycare owner and staff last summer.
-
Hawkesbury, Ont. OPP officer charged with assault
An Ontario Provincial Police officer in Hawkesbury, Ont. has been charged with assault following an incident last summer.
Northern Ontario
-

Northern Ont. First Nation files claim against Ontario and Newmont mining
Taykwa Tagamou Nation, a Cree First Nation located within Treaty 9, has filed a statement of claim against the Province of Ontario and Newmont, a mining company that owns properties in Timmins.
-
Senior killed in dog attack in northern Ont.
An 81-year-old was killed in a dog attack this week in Bonfield, Ont. Police believe three dogs were involved.
-
More carrots pulled from grocery store shelves in expanded recall for E. coli: CFIA
The Canadian Food Inspection Agency has announced an expanded recall on carrots over risks of E. coli O121 contamination, according to a notice issued Friday.
Barrie
-

Missing Collingwood man located
OPP say they have located the missing man who they were searching for in Collingwood on Saturday.
-
Two occupants escape kitchen fire
Emergency crews tended to a fire at a home in Alliston Saturday afternoon where the two occupants were evacuated safely.
-
Barrie magic mushroom dispensary closed after company announces its shuttering Ont. locations
The doors are locked and the OPEN sign is off on Friday at an illegal magic mushroom dispensary in downtown Barrie one day after FunGuyz announced it would shutter its 30 Ontario locations.
Kitchener
-

Advocates push for anti-renoviction bylaws as Waterloo Region reports affordable housing progress
On National Housing Day, housing advocacy group ACORN continued to push for anti-renoviction bylaws.
-
Kitchener auto repair shop hosts fundraiser for children with disabilities, joined by hockey legend Wendel Clark
An auto repair shop based in Kitchener held a special fundraiser Saturday to help children and youth with physical disabilities, with former Maple Leafs captain Wendel Clark in attendance.
-
Laval wins Vanier Cup in Saturday game against Laurier
The Laval Rouge et Or won the coveted Vanier Cup against the Wilfrid Laurier Golden Hawks, going 22-17.
London
-

Two people airlifted, several taken to hospital due to collision
Two people have been airlifted to hospital following a serious collision in Norfolk County.
-
South Bruce residents vote in favour of hosting nuclear waste project in narrow referendum
South Bruce residents narrowly voted in favour of plans to bury Canada’s most radioactive nuclear waste under their municipality on Monday.
-
St. Thomas, Ont. and San Jose, Calif. celebrate hockey legend on night his jersey is retired
The Jumbo elephant monument in St. Thomas, Ont. will be lit in teal Saturday night as the city honours hockey legend Joe Thornton.
Windsor
-

Charity produces record amounts of non-perishable food amidst rise in food insecurity
A Windsor-Essex charitable organization created a record amount of non-perishable food amidst an increase in food insecurity, both at home and abroad.
-
No impaired drivers detected during Friday night RIDE checks
The Windsor Police Service reports no detected impaired drivers on Friday night during their RIDE checks.
-
Truck fire on the Ambassador Bridge
Windsor fire responded to a transport truck fire on Friday afternoon on the Ambassador Bridge.